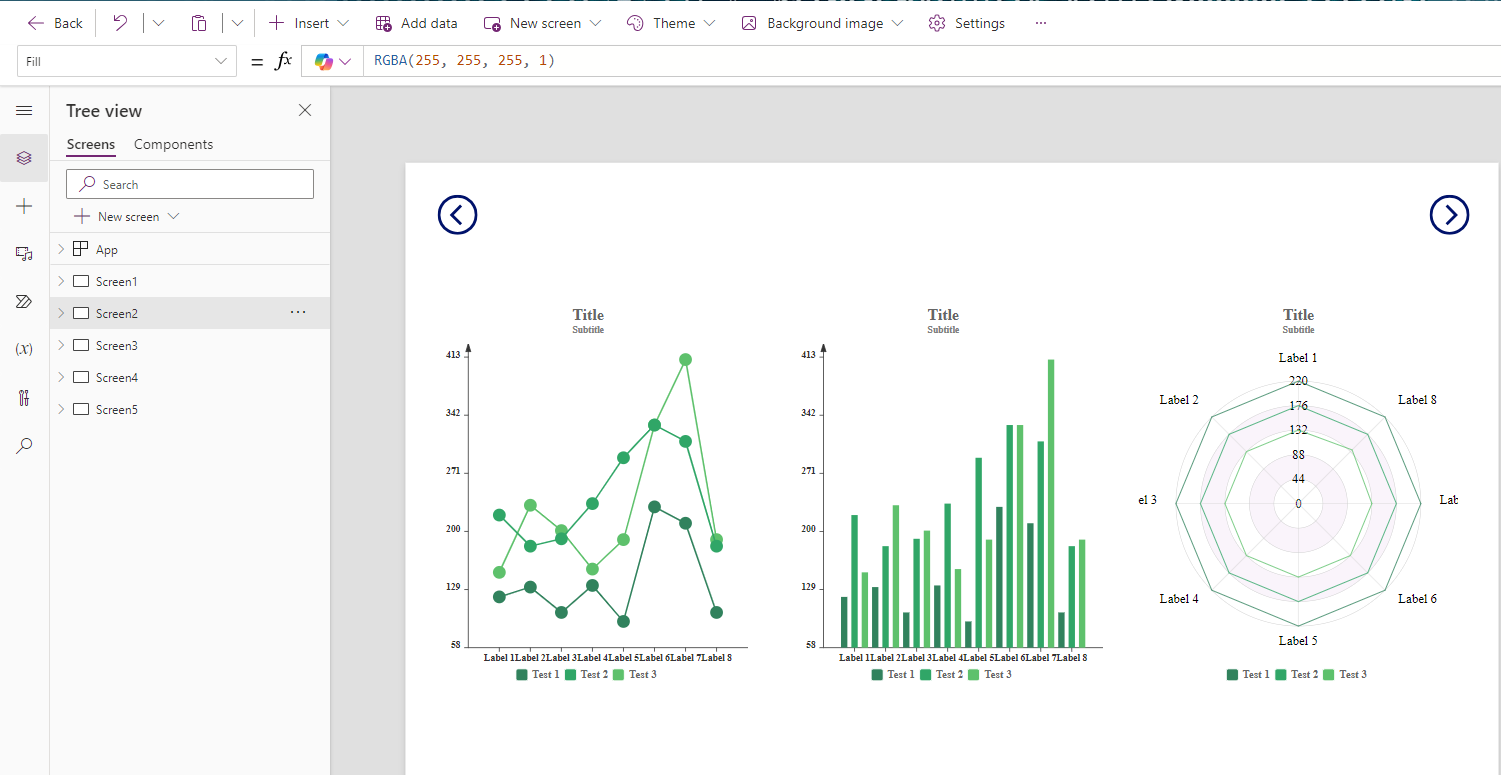
In this article, I plan to share how I managed to meet a business requirement by using a custom spider/radar chart.
I turned to Google for help and came across a fantastic GitHub repository from 2018 (wow), where this problem had already been solved.
All you need to do is download the msapp file.
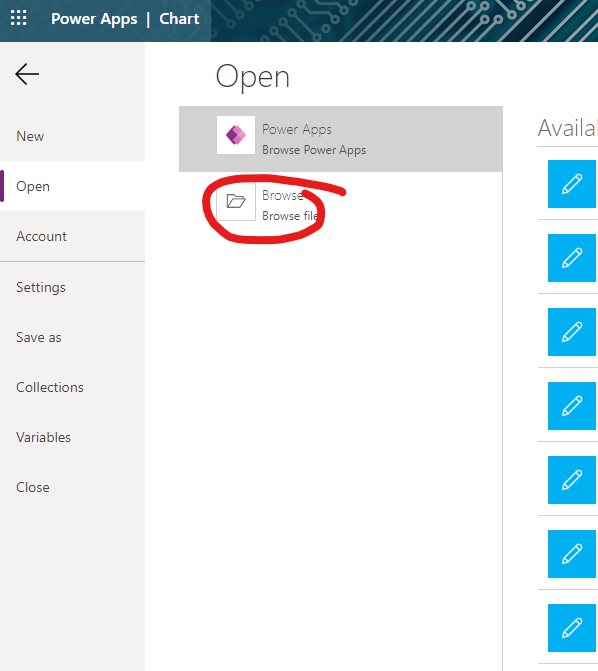
Go to your Power Apps and press Open

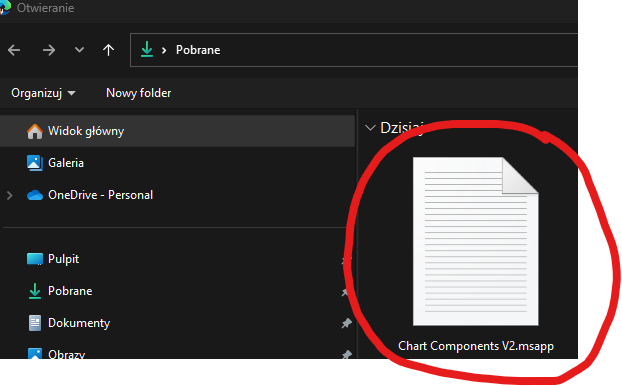
Press Browse
Select file Chart Component V2.msapp
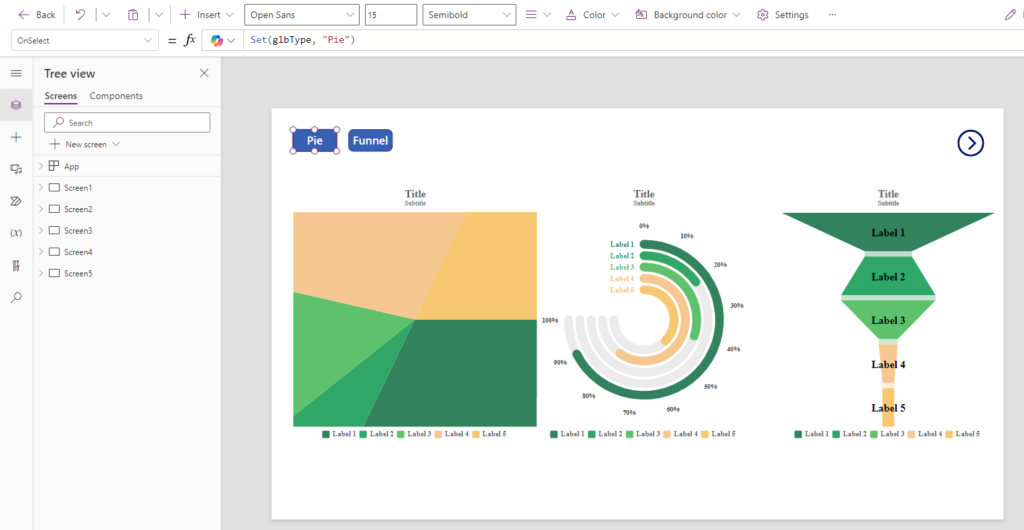
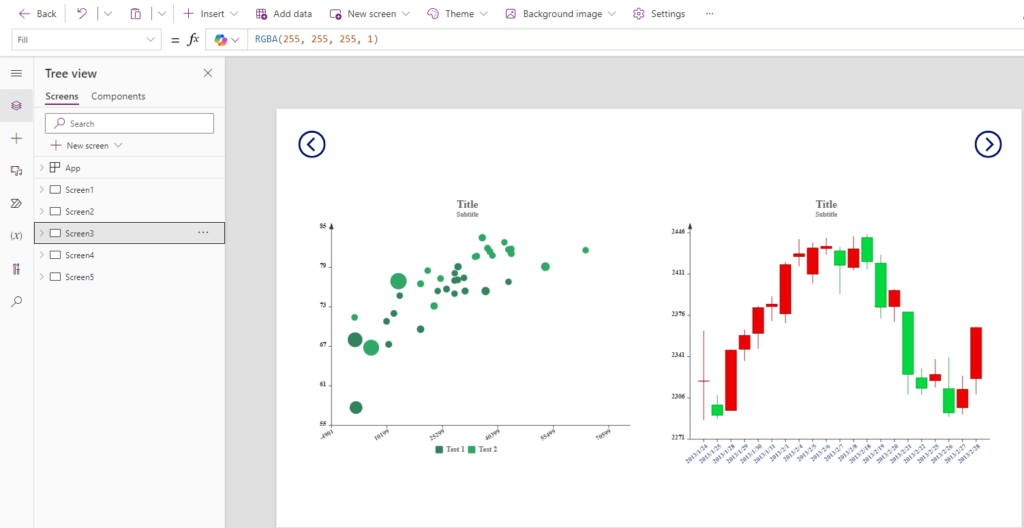
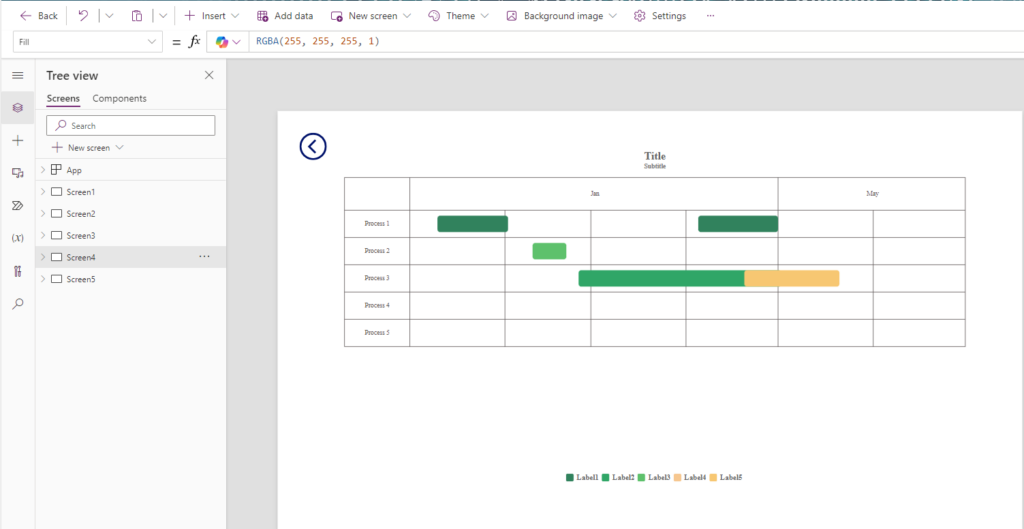
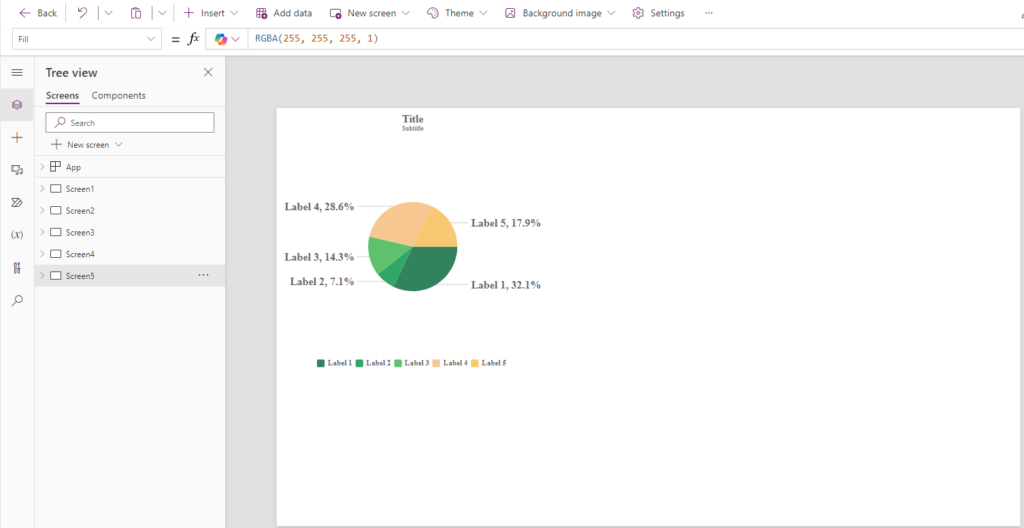
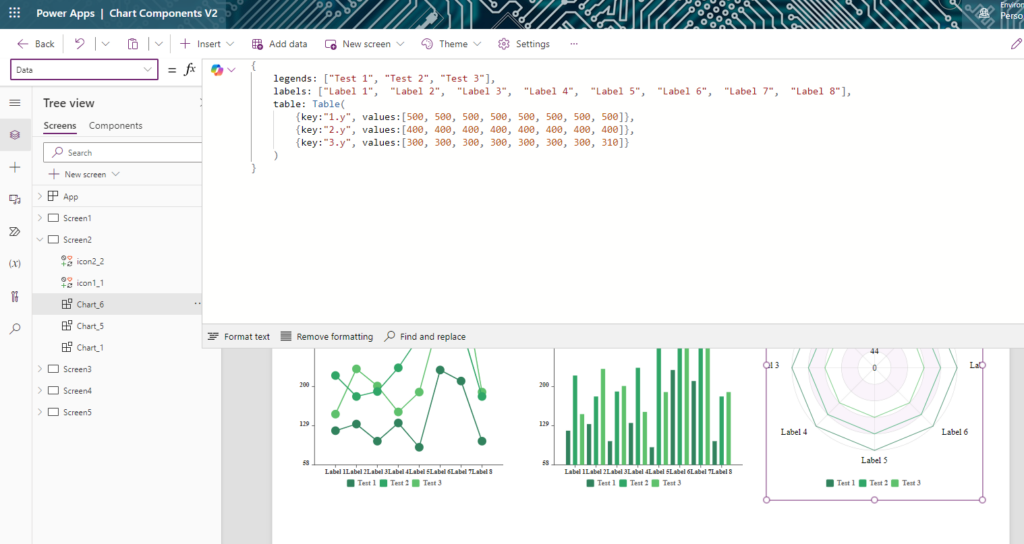
Wait a moment, and after a short while, five screens will appear, each with different charts that you can freely use and modify their properties.
Now you can use in your solution:
- Pie
- Solid Gauge
- Funnel
- Line
- Bar
- Radar
- Scatter
- Candle Stick
- Gantt – Yes, a Gantt chart too!

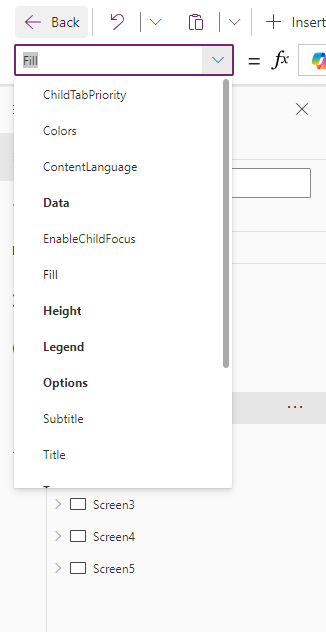
For each chart you can modify properties:
A big round of applause for the creators!
| Author(s) |
|---|
| Todd Baginski (Microsoft MVP, Canviz) @tbag |
| Hubert Sui (Canviz) @hubertsui |
| Cloris Sun (Canviz) @cloriss |
| Chad Liu, (Canviz) @chadliuxc |
| Tyler Lu, (Canviz) @TylerLu |
| Catherine Xiao, (Canviz) |
| Cathy Cheng, (Canviz) |
| Matt Schuessler, (Canviz) |
| Christina Wheeler, (Microsoft MVP, Canviz) |
| Emmanuel Gallis (Microsoft MVP) @e-gallis |
__________________
Would you like to benefit from consultations dedicated to Microsoft 365, Power Platform, Azure solutions, or would you like to build your Intranet in a very unique and personalized way? Take advantage of the services of the company I have the opportunity to work for! Our specialized team will certainly be happy to listen to your needs and take care of them!
If you have any questions, feel free to contact us.